EuroMed Climate Education Atlas
Presented at COP31 in Antalya on 17 November 2026, the visual interface of the EuroMed University Initiative for Climate Action is a data visualization system that maps university programmes on climate and the environment developed within projects funded by the European Union and by Euro-Mediterranean cooperation.
- Visual design
- Interactive design
- Data visualization
1 video13 images
The presentation at COP31
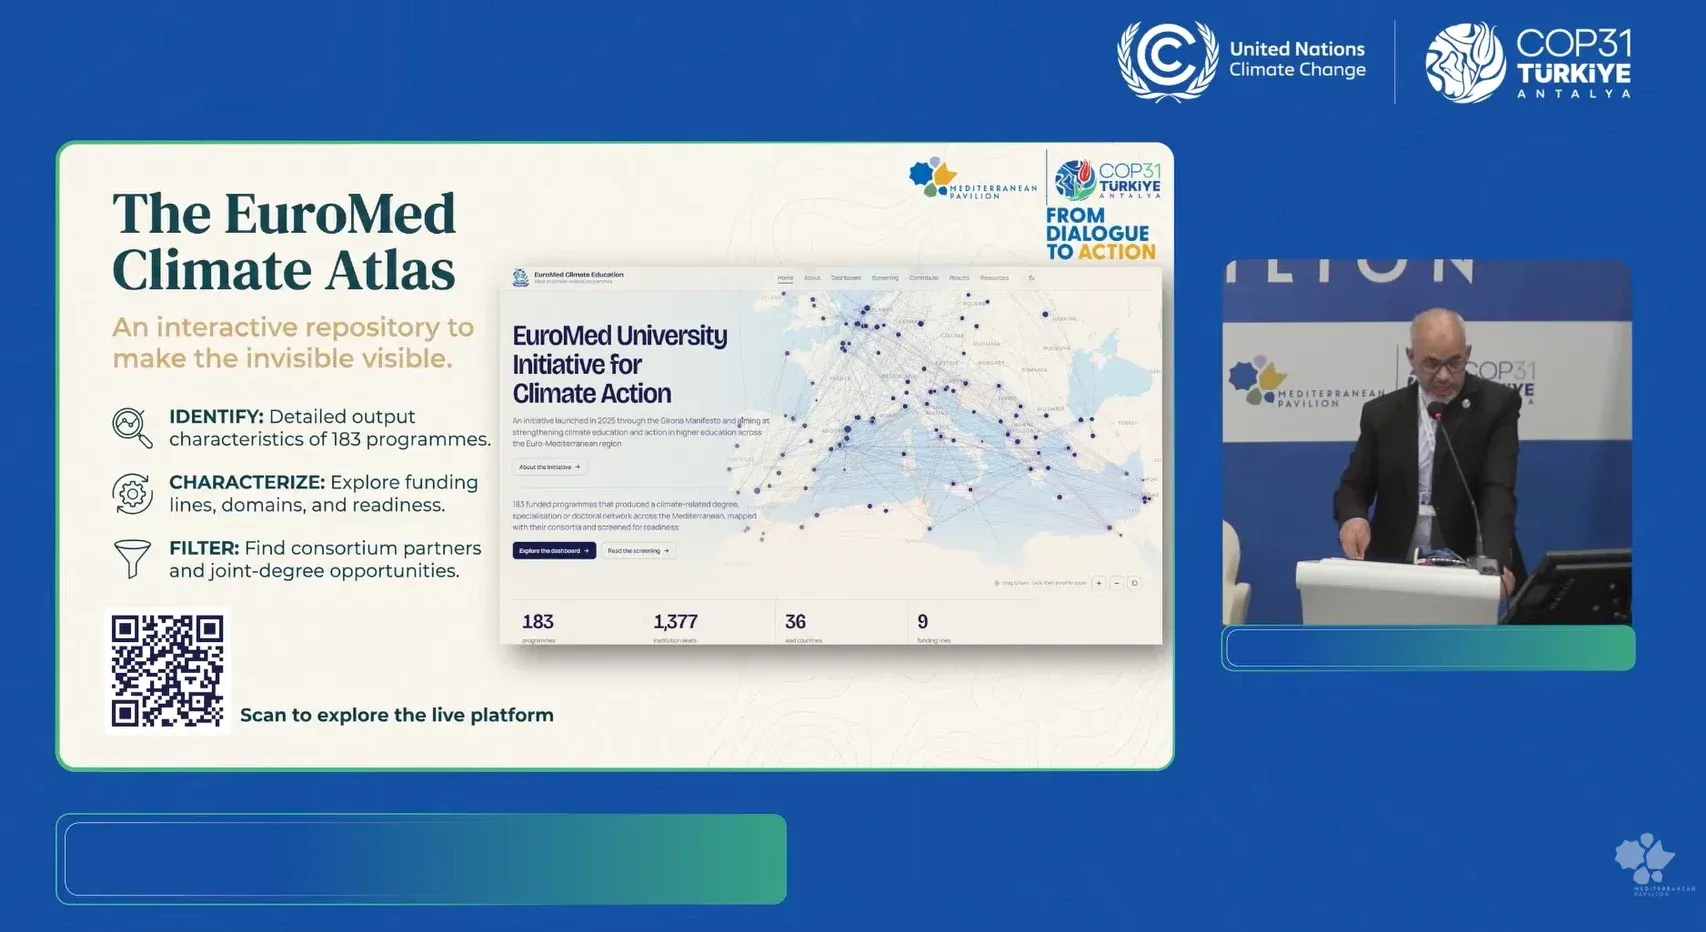
The Atlas was presented on 17 November 2026 at the Mediterranean Pavilion of COP31 in Antalya, at the session «From Commitment to Action: Mapping and Harmonizing Climate Education across Mediterranean Universities» organised by UfM and UNIMED. The recording is on the Pavilion’s YouTube channel: the presentation of the Atlas starts at 15:22.
3 items
The project
The project is part of the path opened by the Girona Manifesto, which came out of a meeting of university leaders and experts in June 2025 and was presented at COP30. Endorsed by more than one hundred universities, the Manifesto lists among its priorities the mapping of existing academic programmes and the development of shared guidelines for climate education.
The initiative is coordinated by the Union for the Mediterranean (UfM), with UNIMED – Mediterranean Universities Union in charge of the technical assistance, and the University of Girona and Prof. Adil Salhi of Abdelmalek Essaâdi University as collaborating institutions.
2 items
Visual design and data visualization
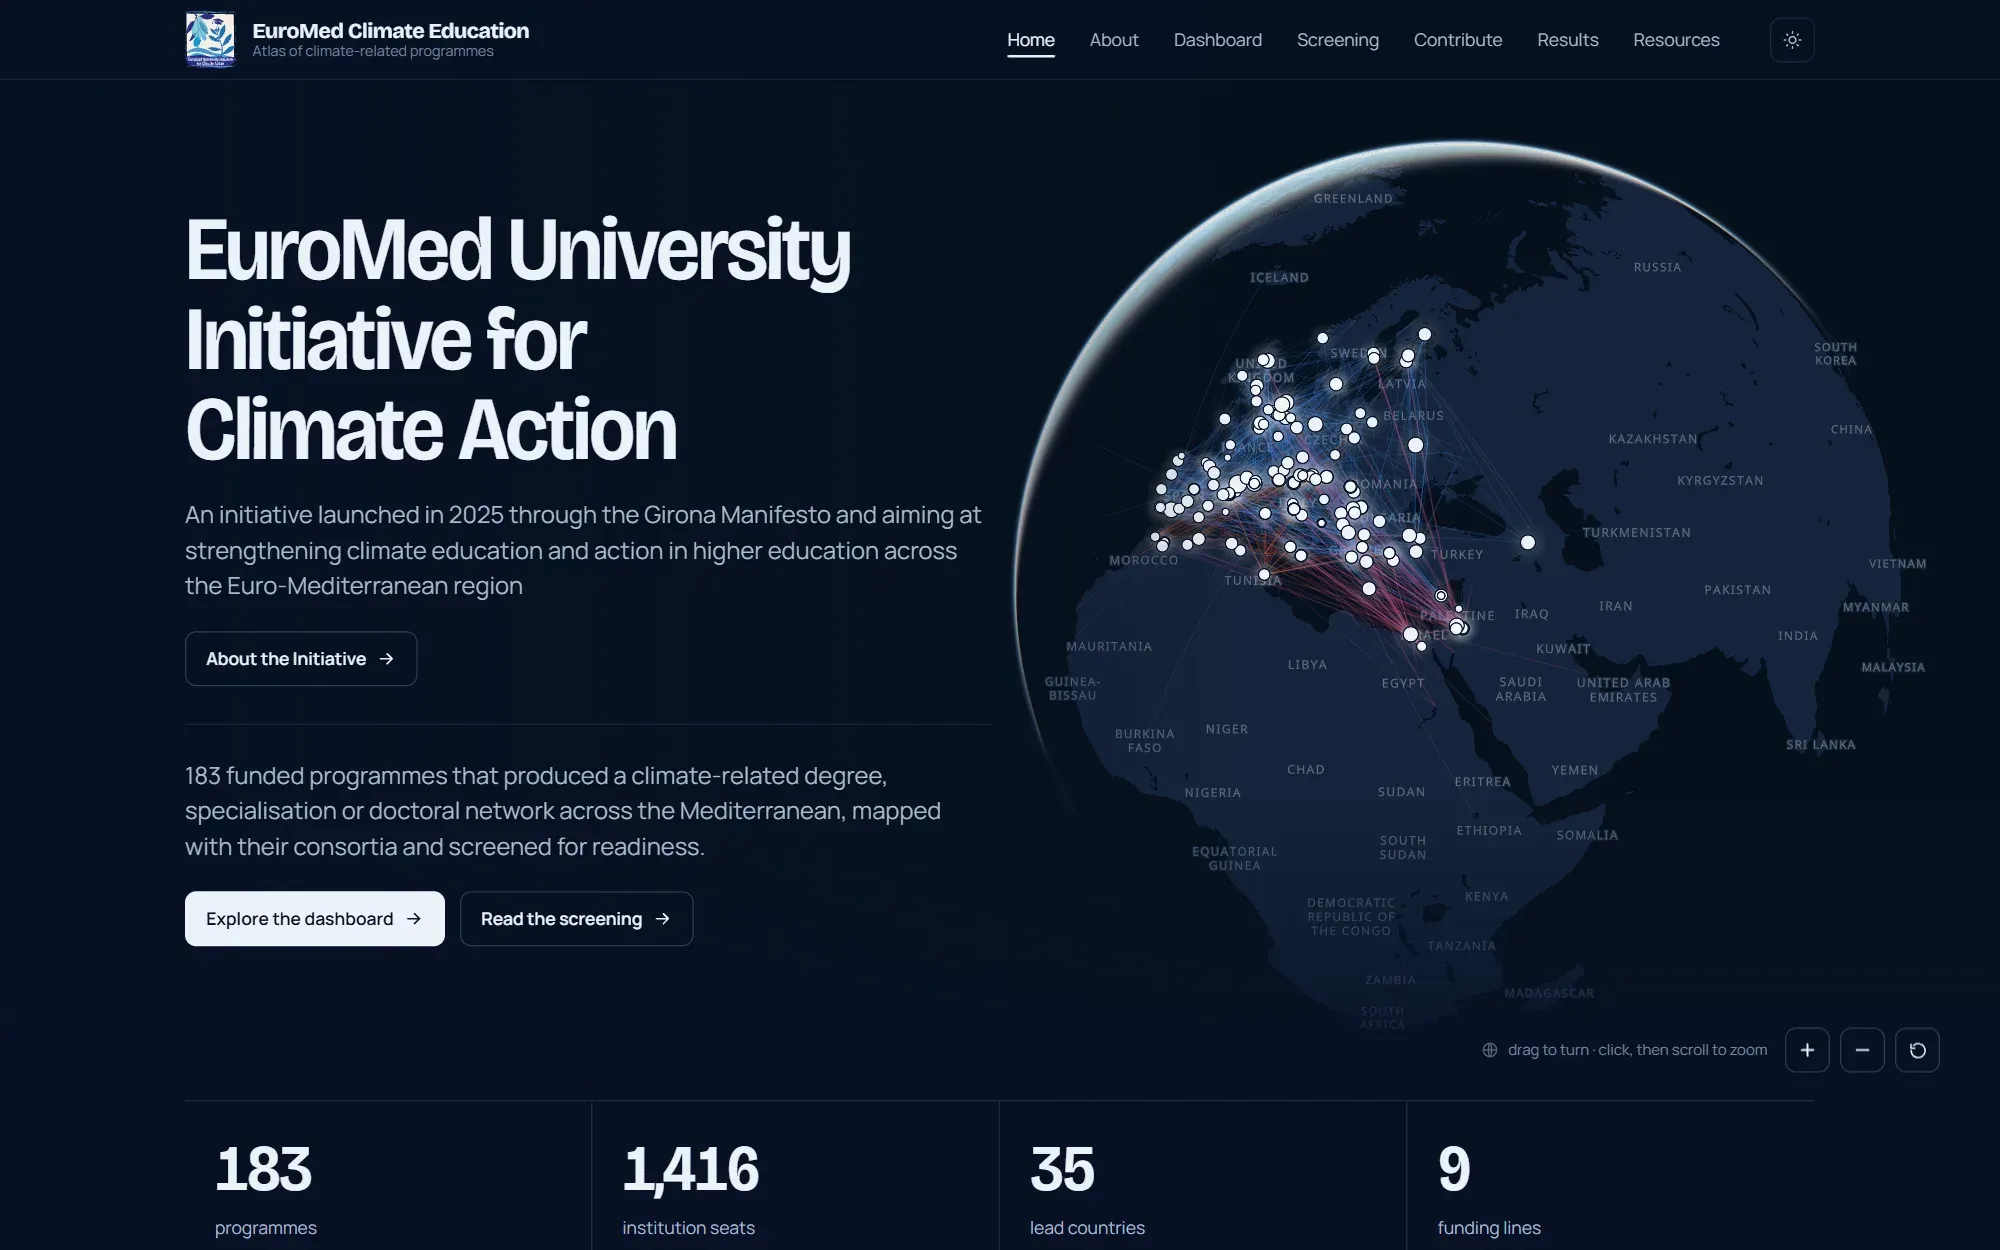
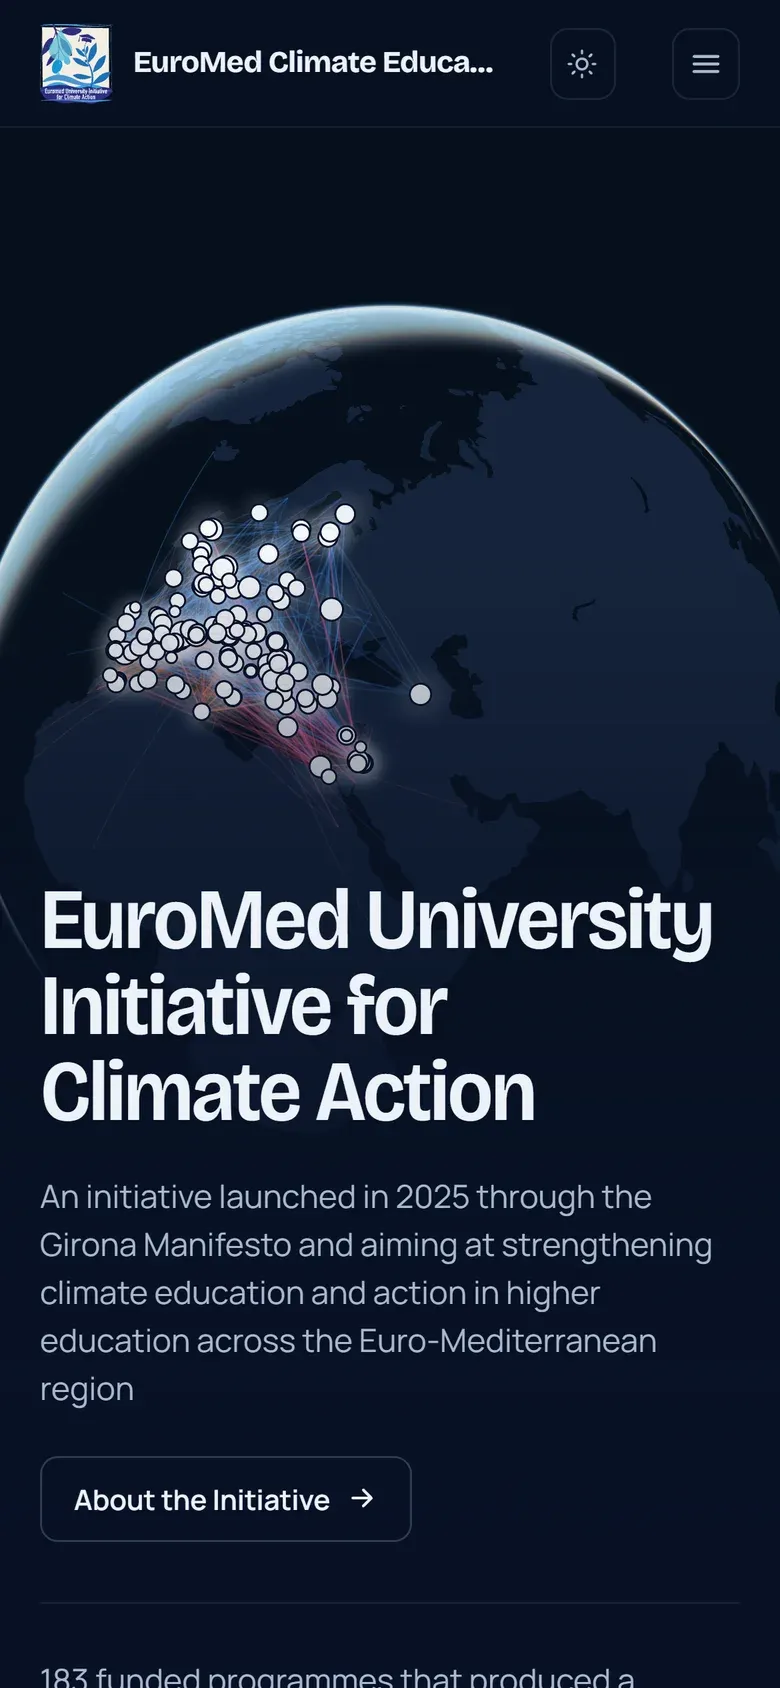
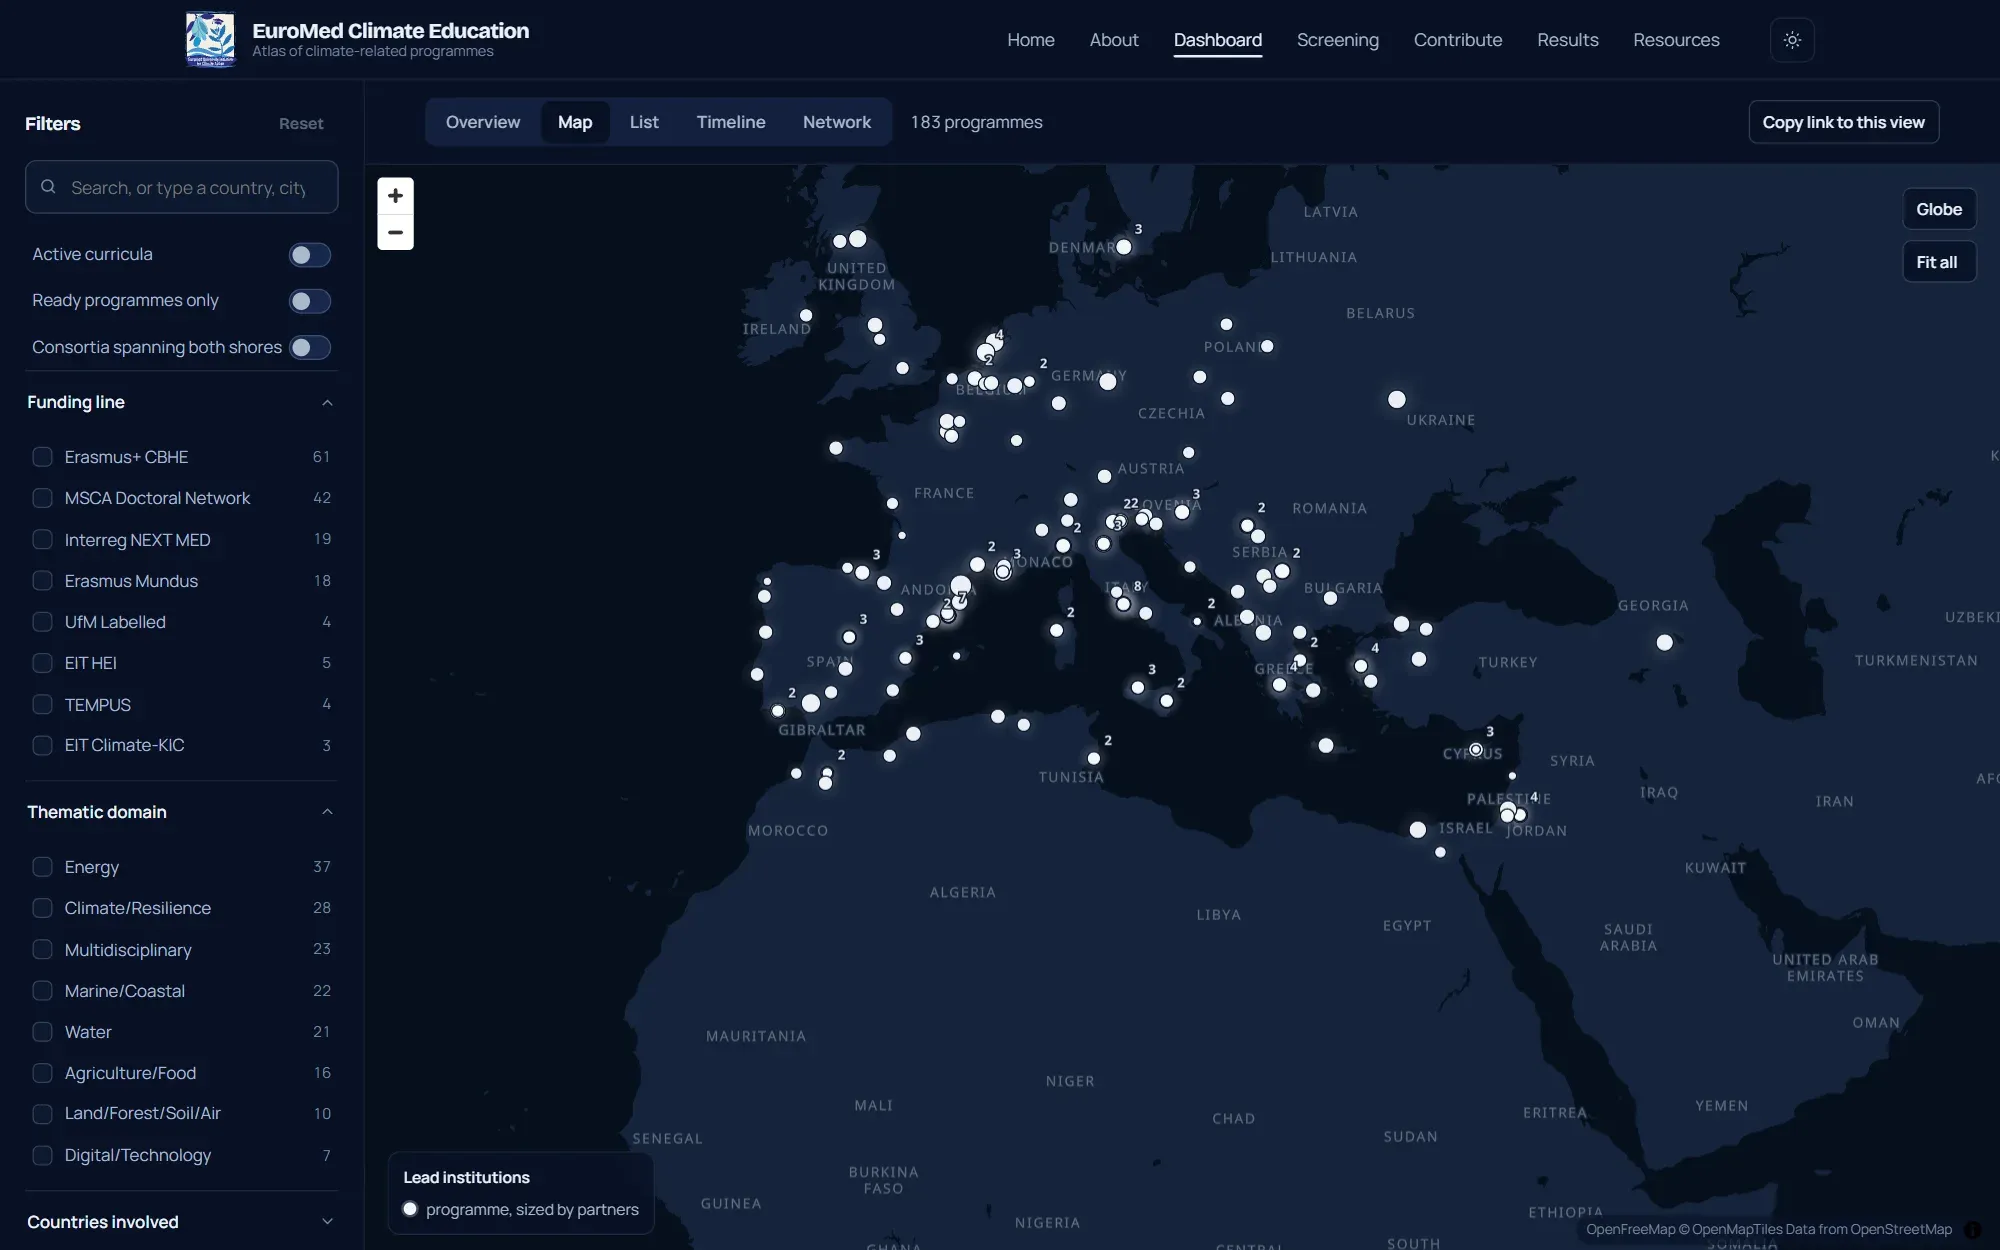
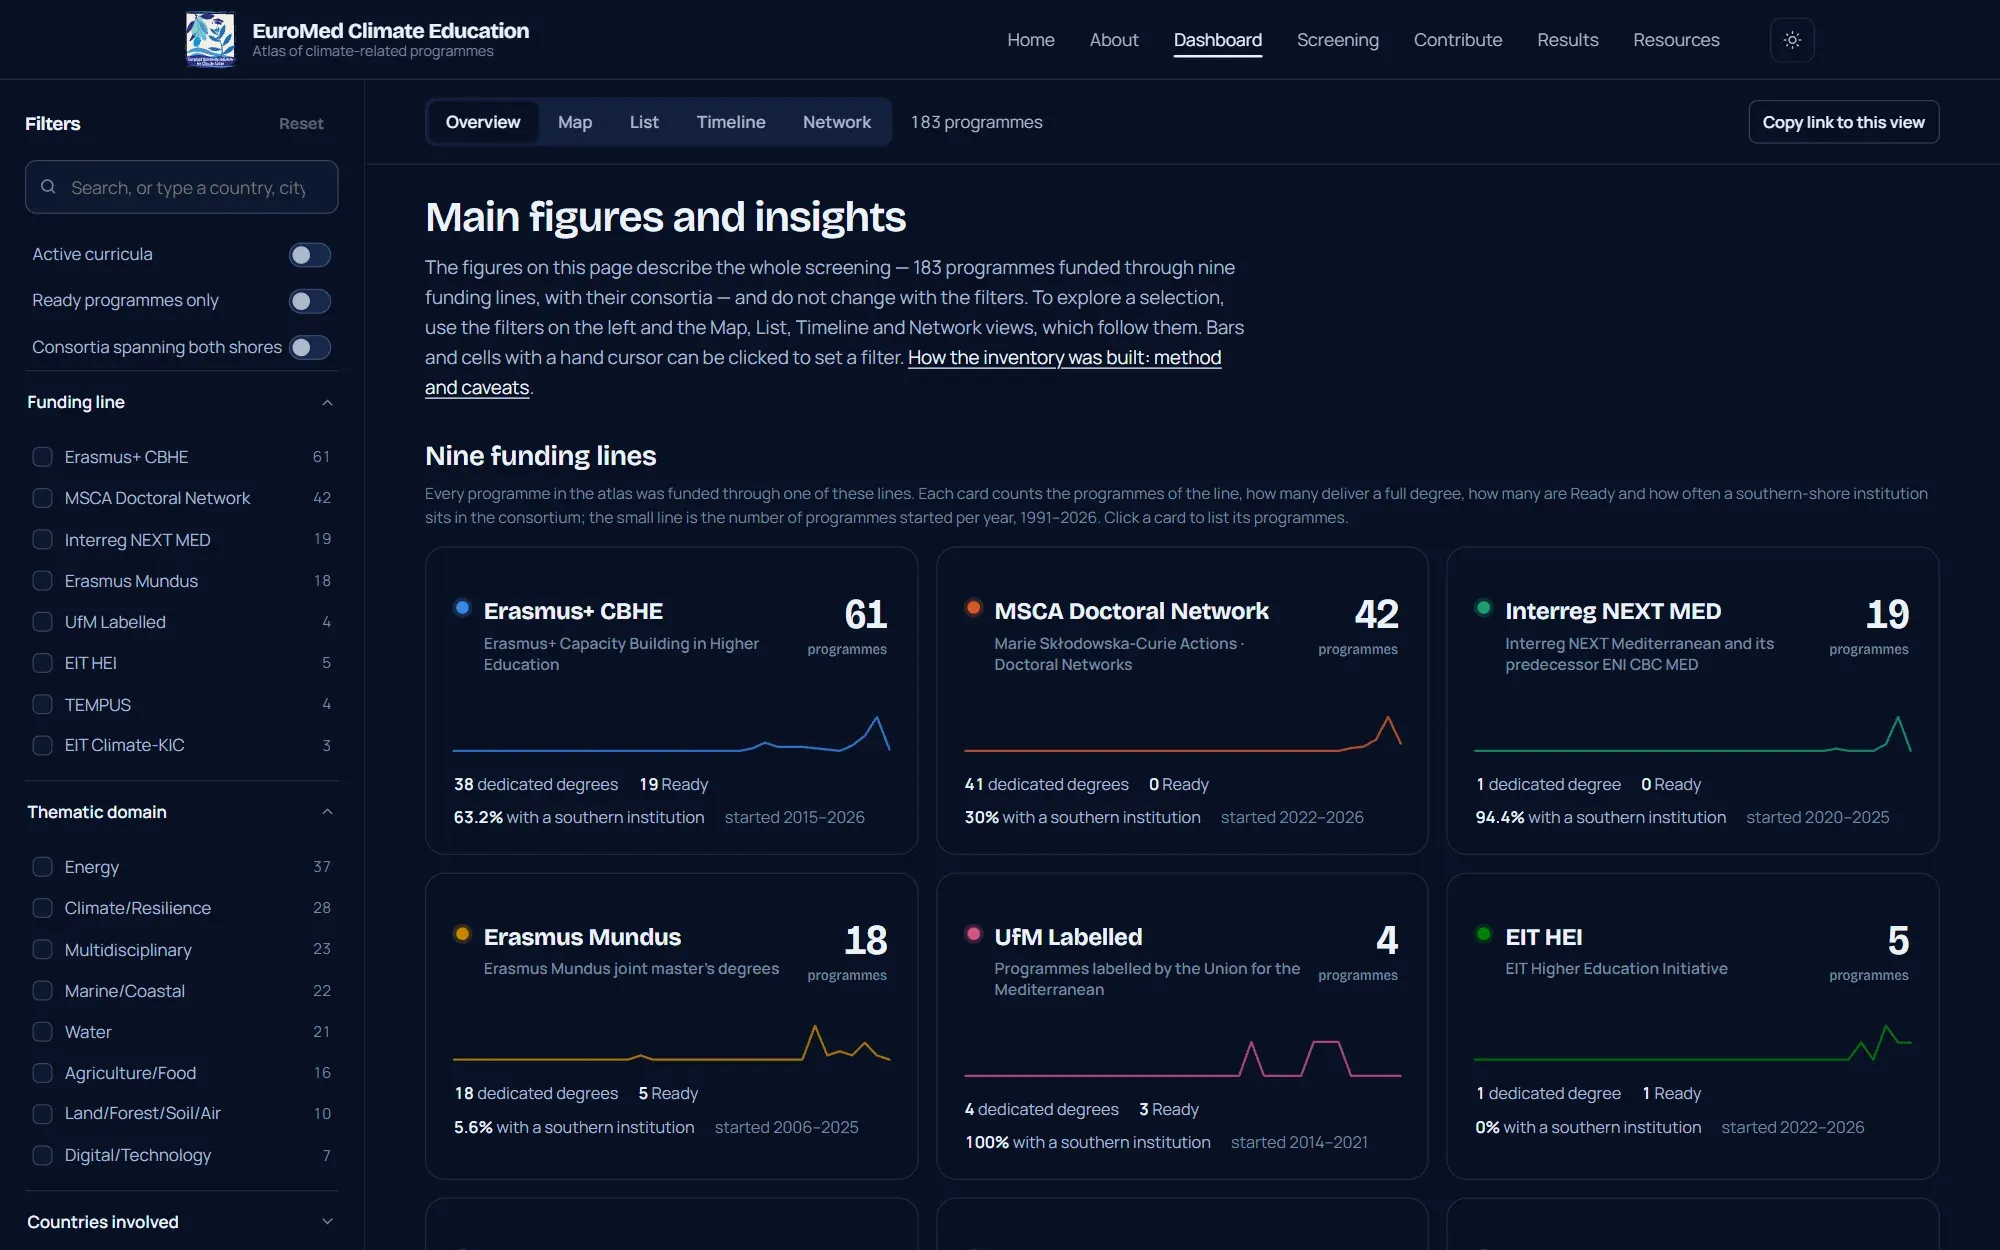
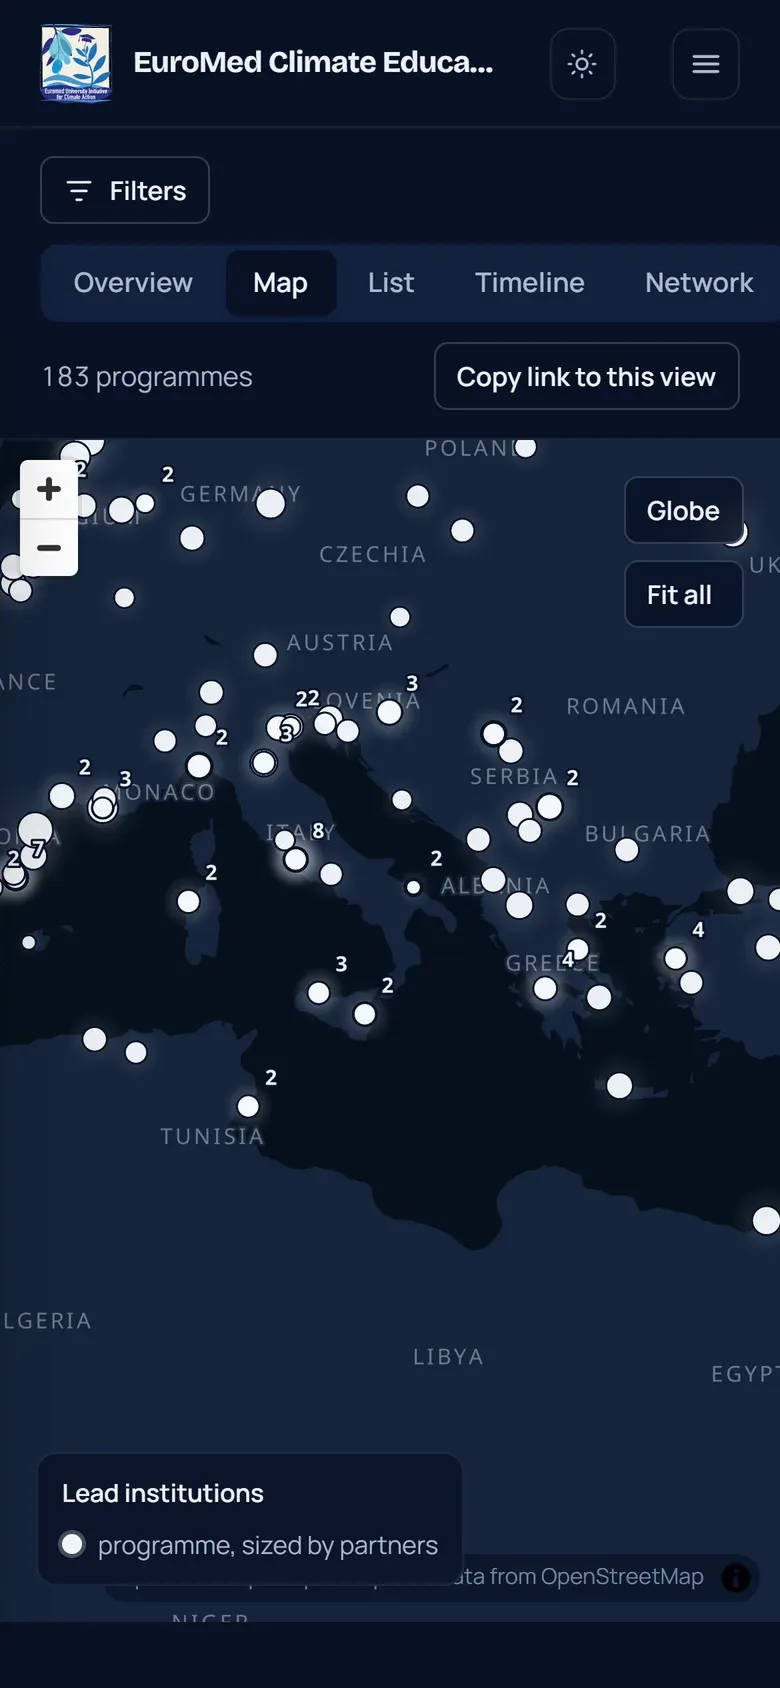
The Atlas brings together the 183 funded programmes that produced a climate-related degree, specialisation or doctoral network in the Euro-Mediterranean region. The home page opens on a globe turned towards the Mediterranean, showing the institutions involved and the links between consortium partners.
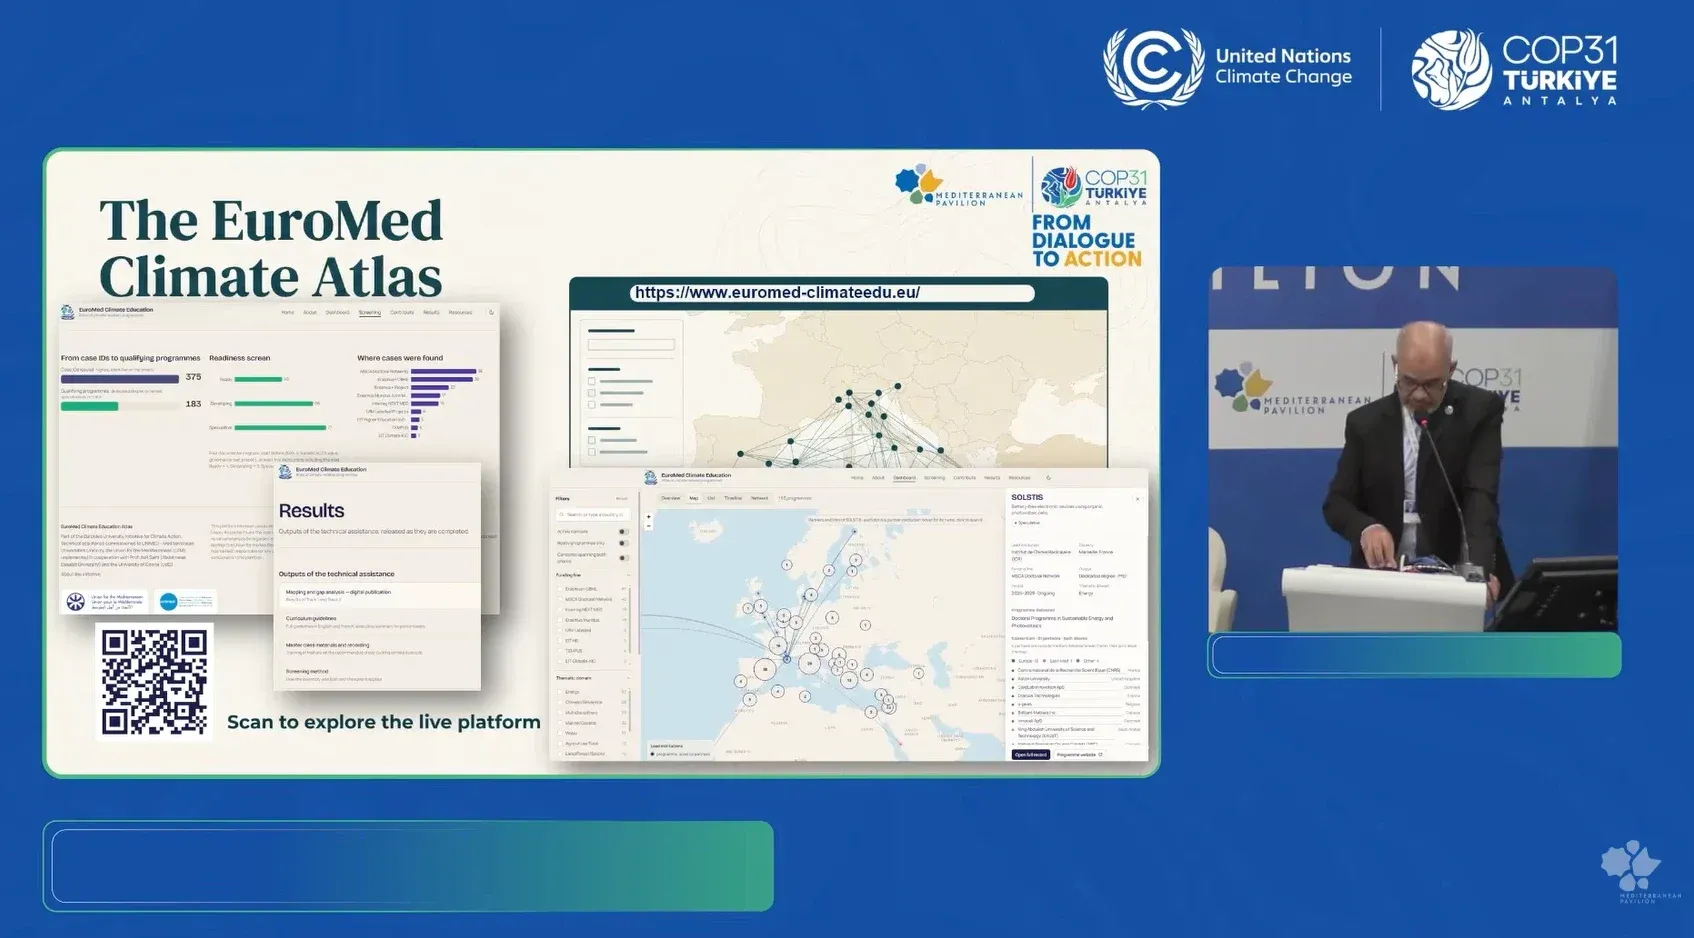
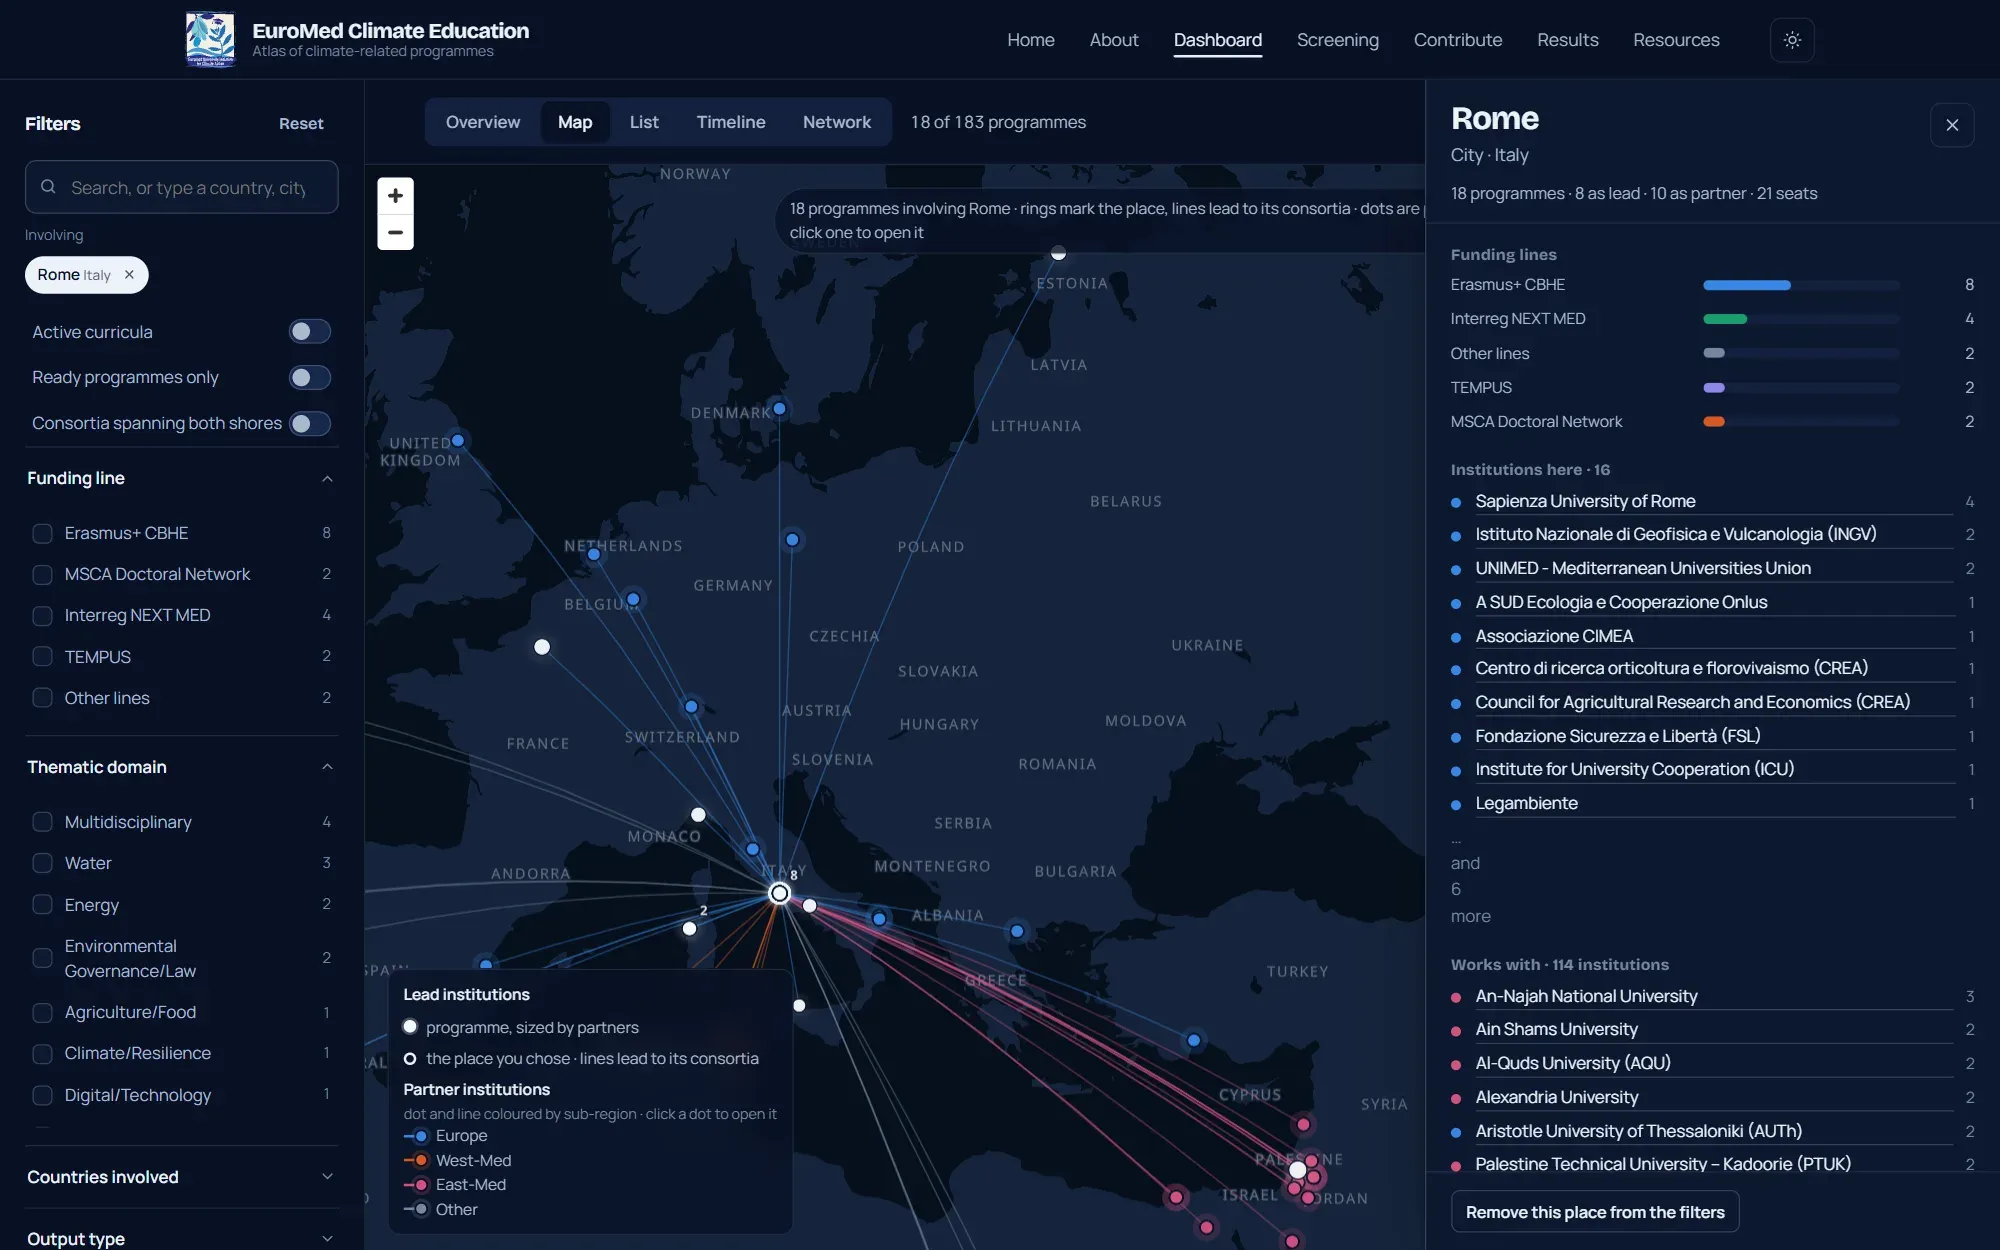
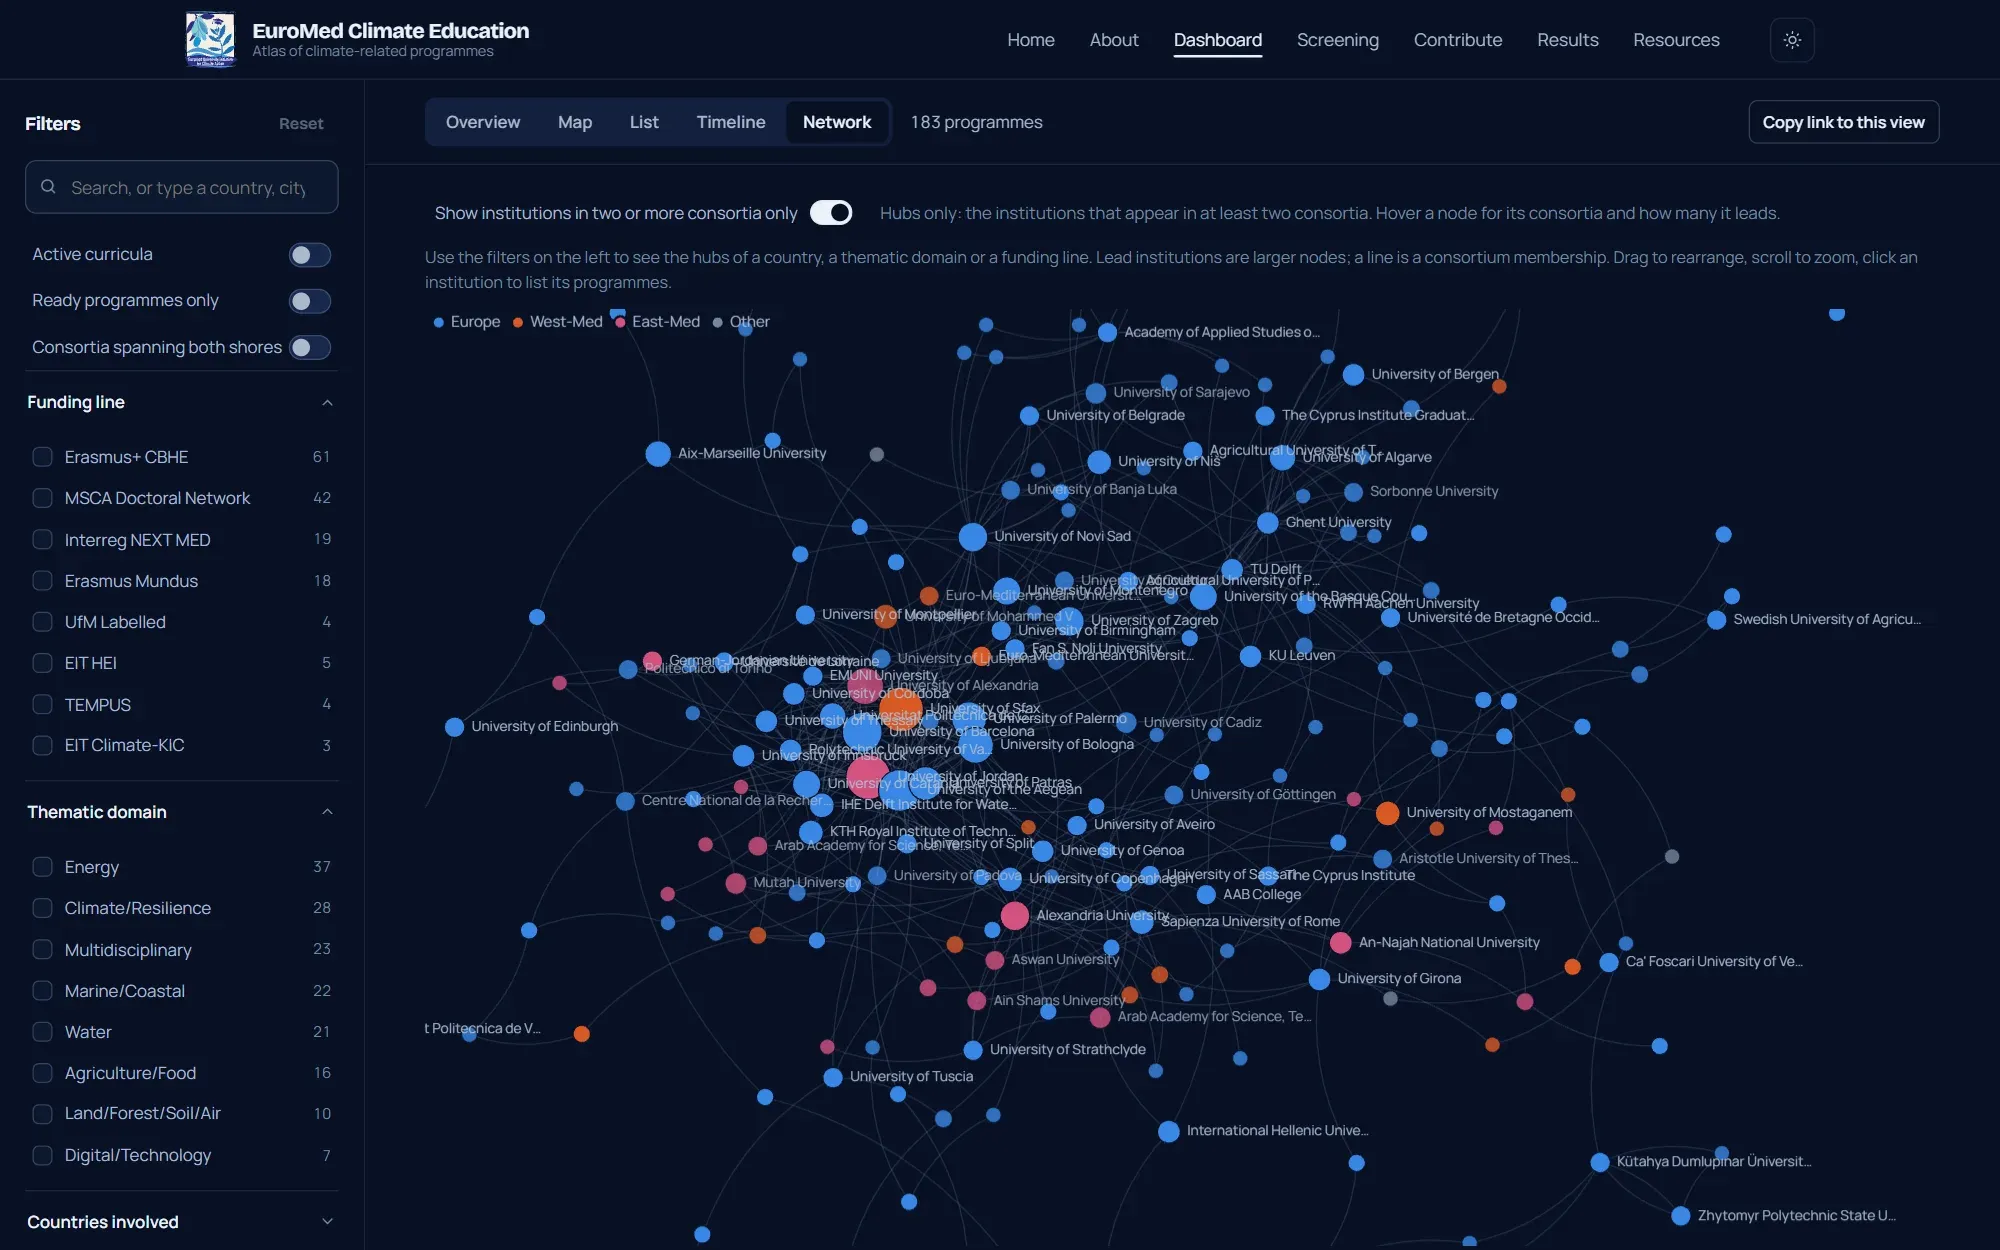
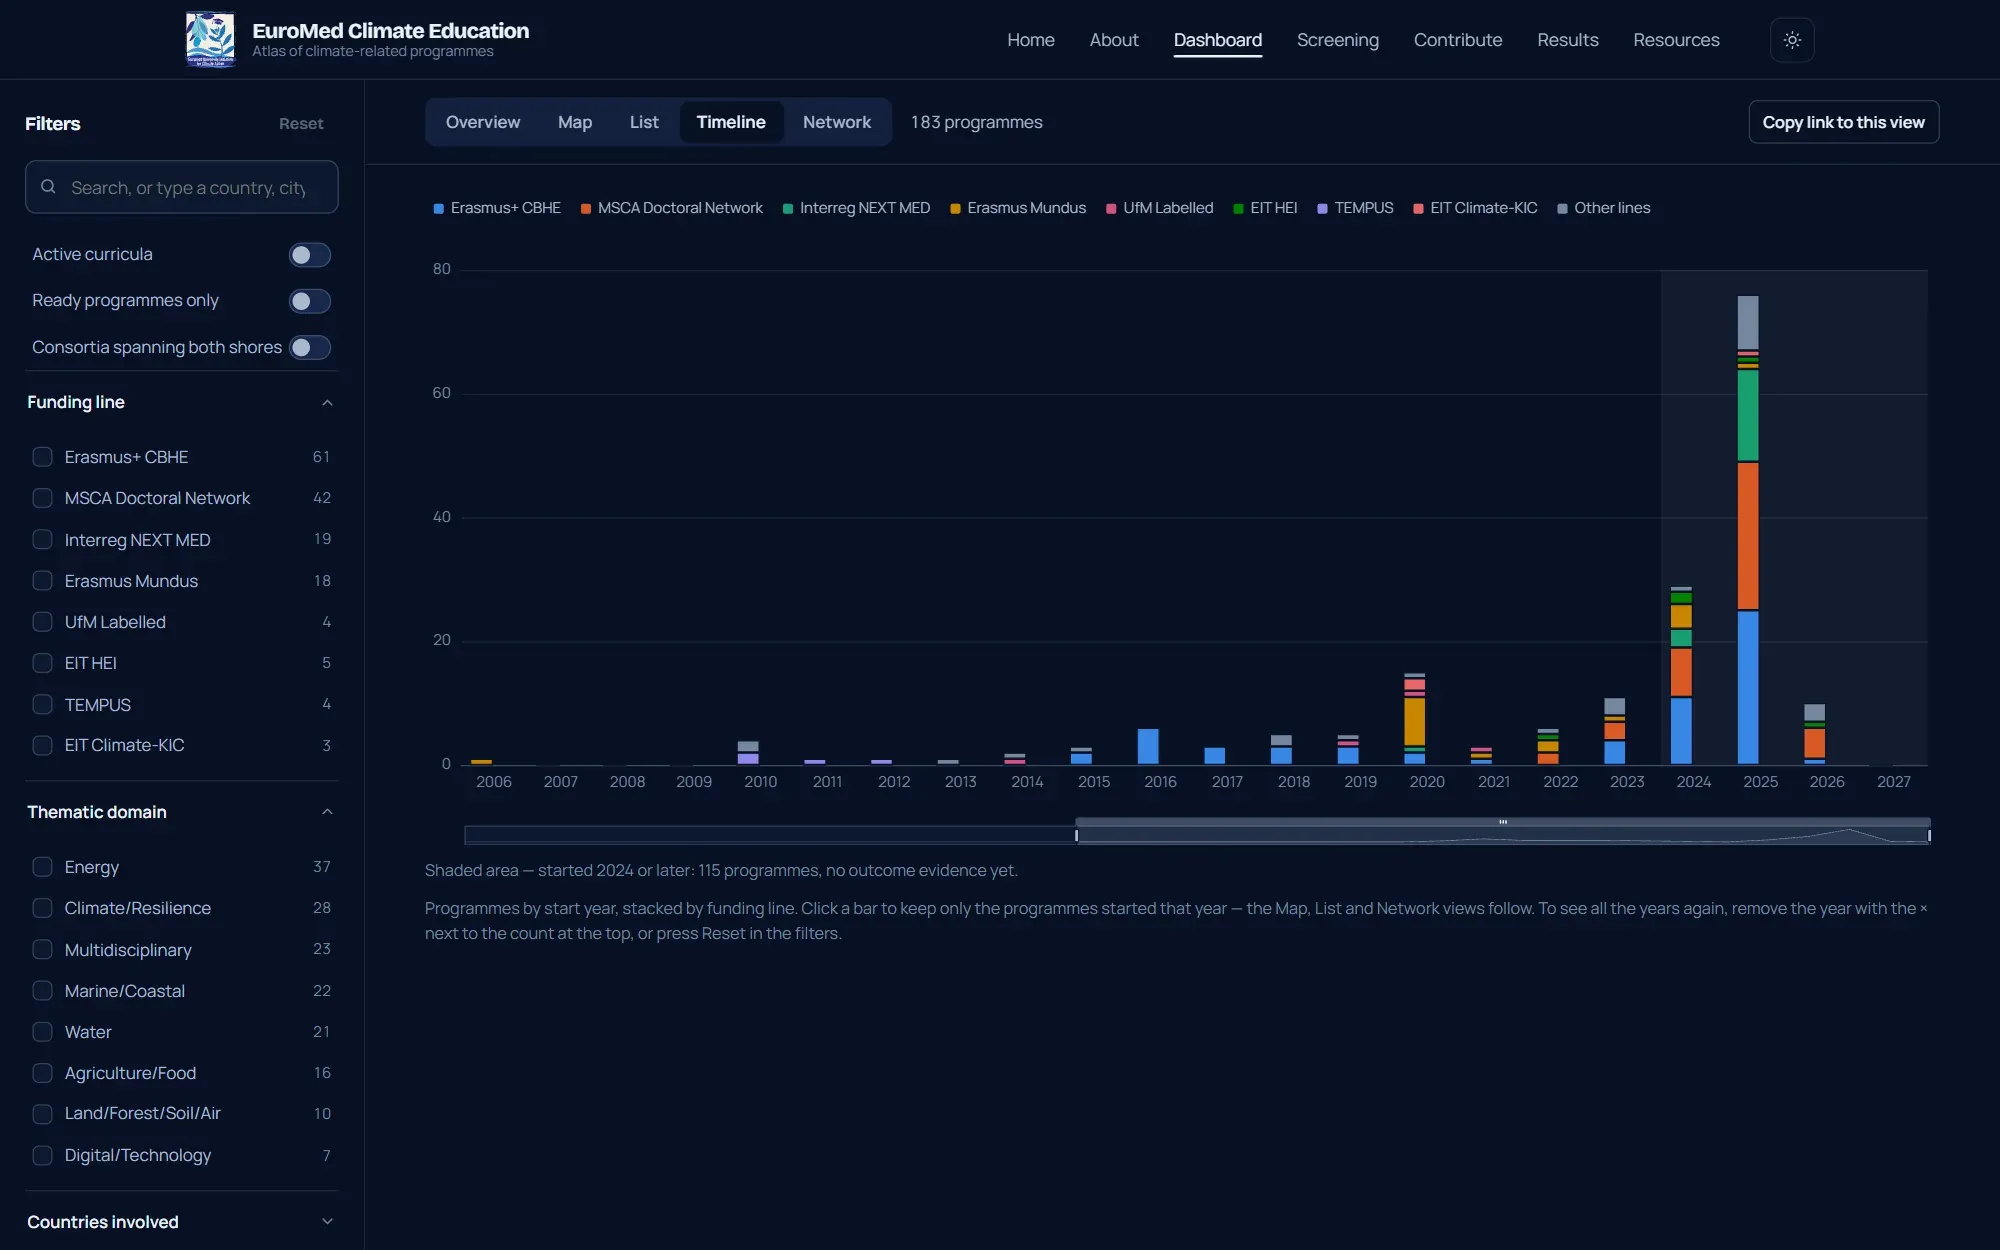
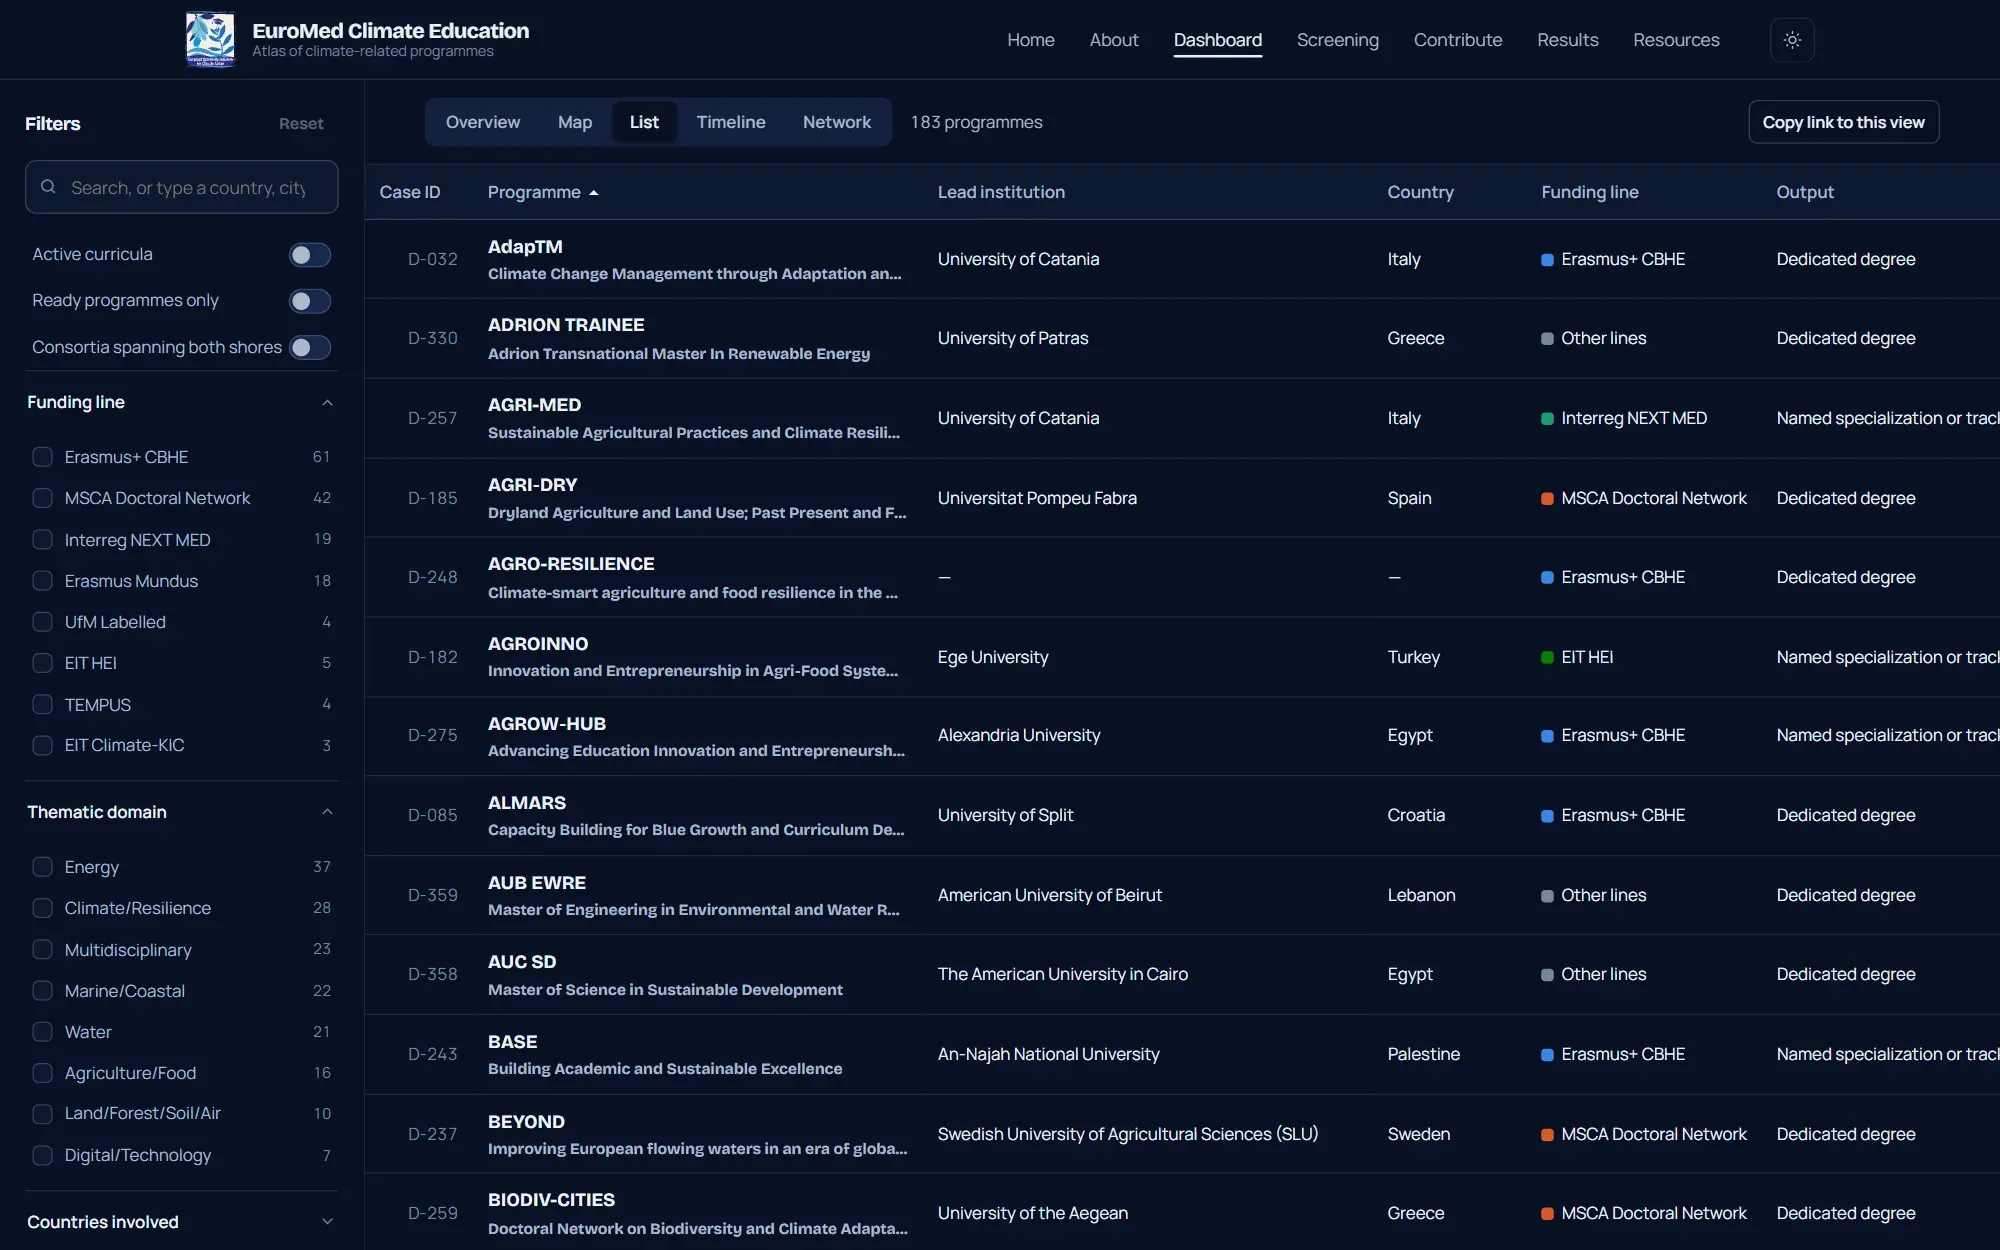
The dashboard presents the same data in five views: overview, map, list, timeline and network. Filters by country, funding line, thematic domain and readiness apply to every view; browsing by place opens a country, a city or an institution and shows on the map every programme it takes part in.
6 items
Records and screening
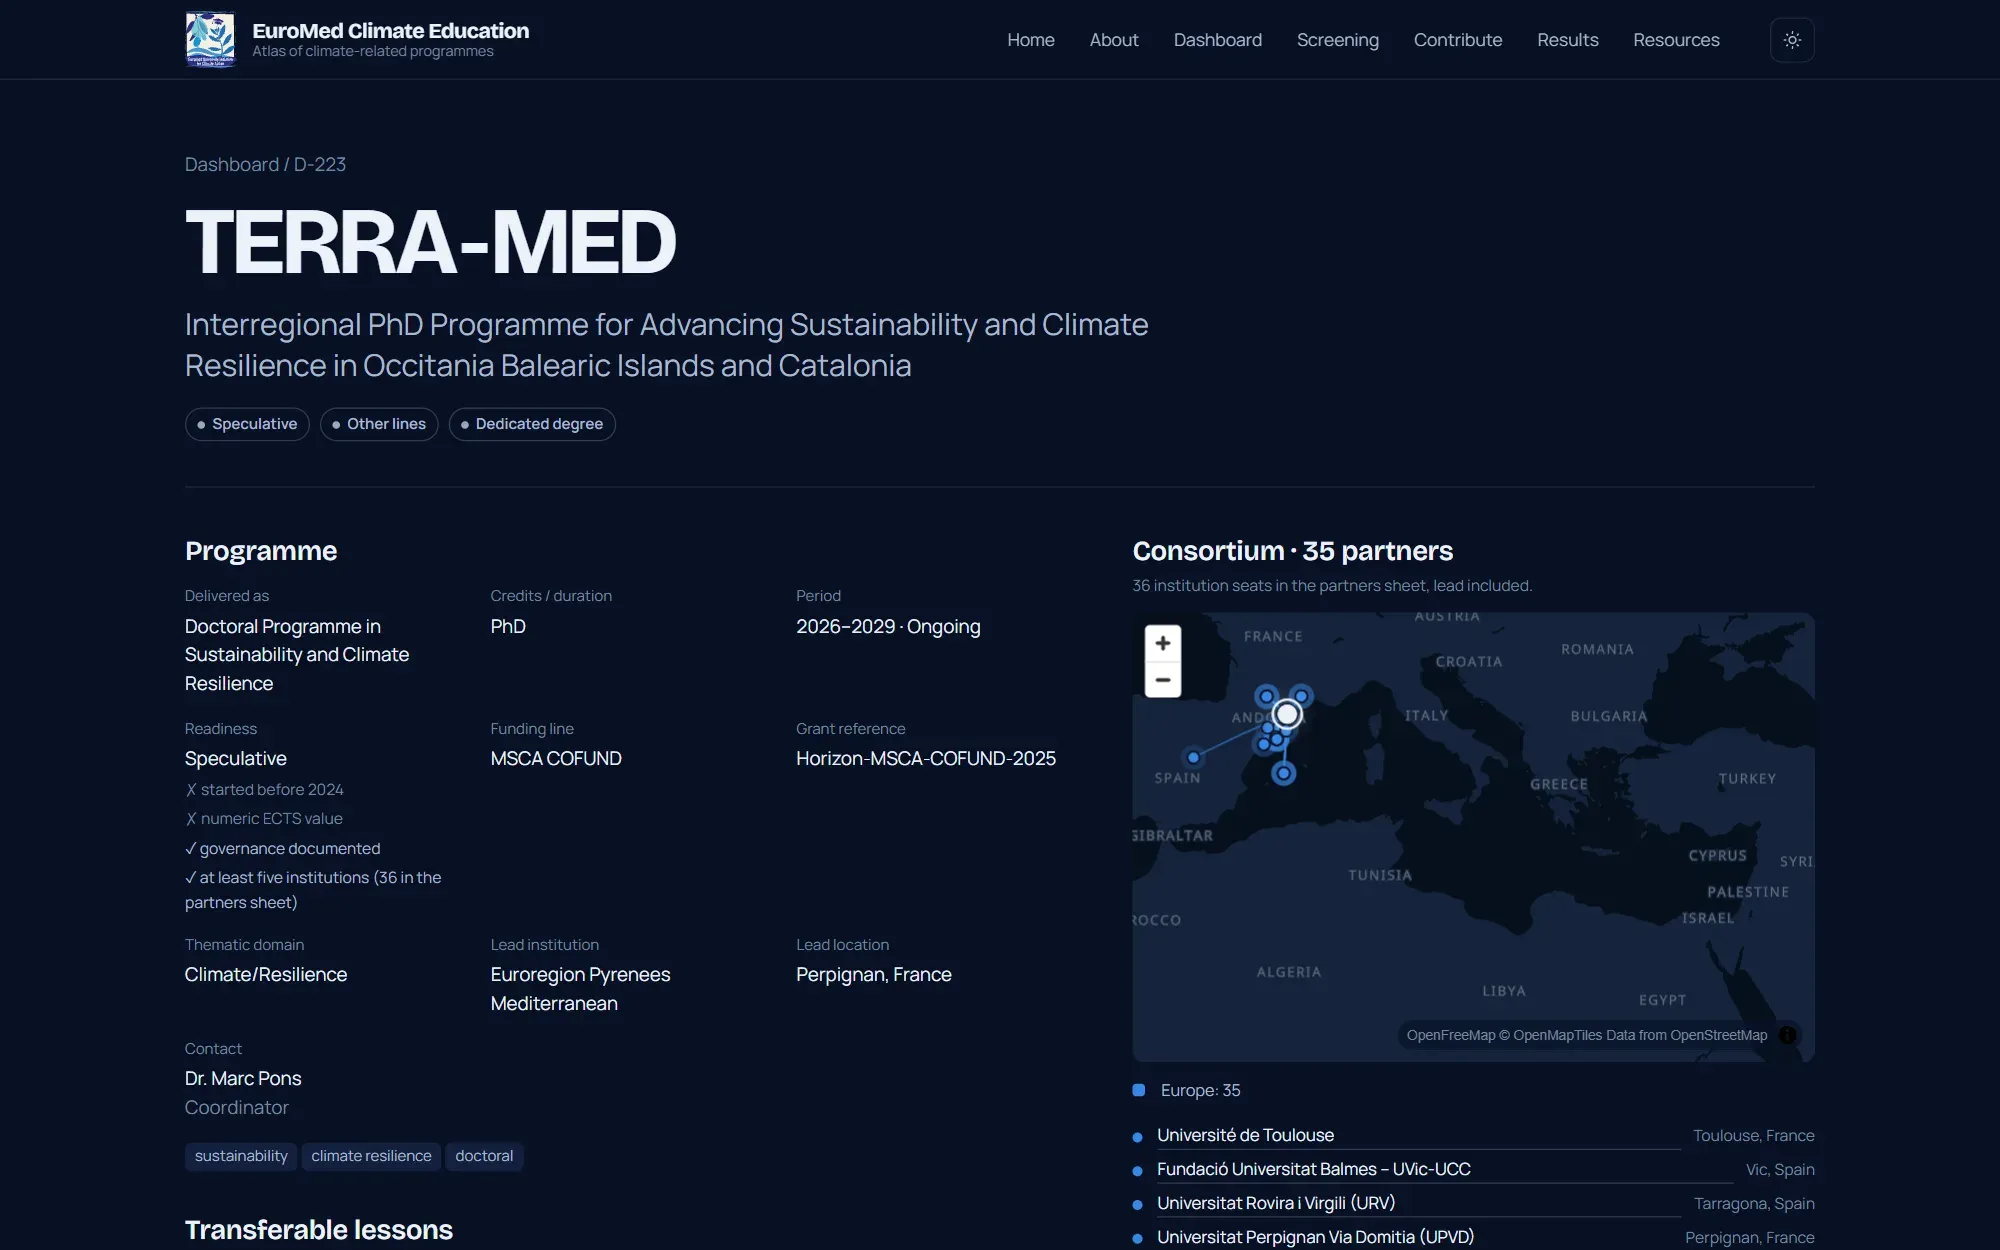
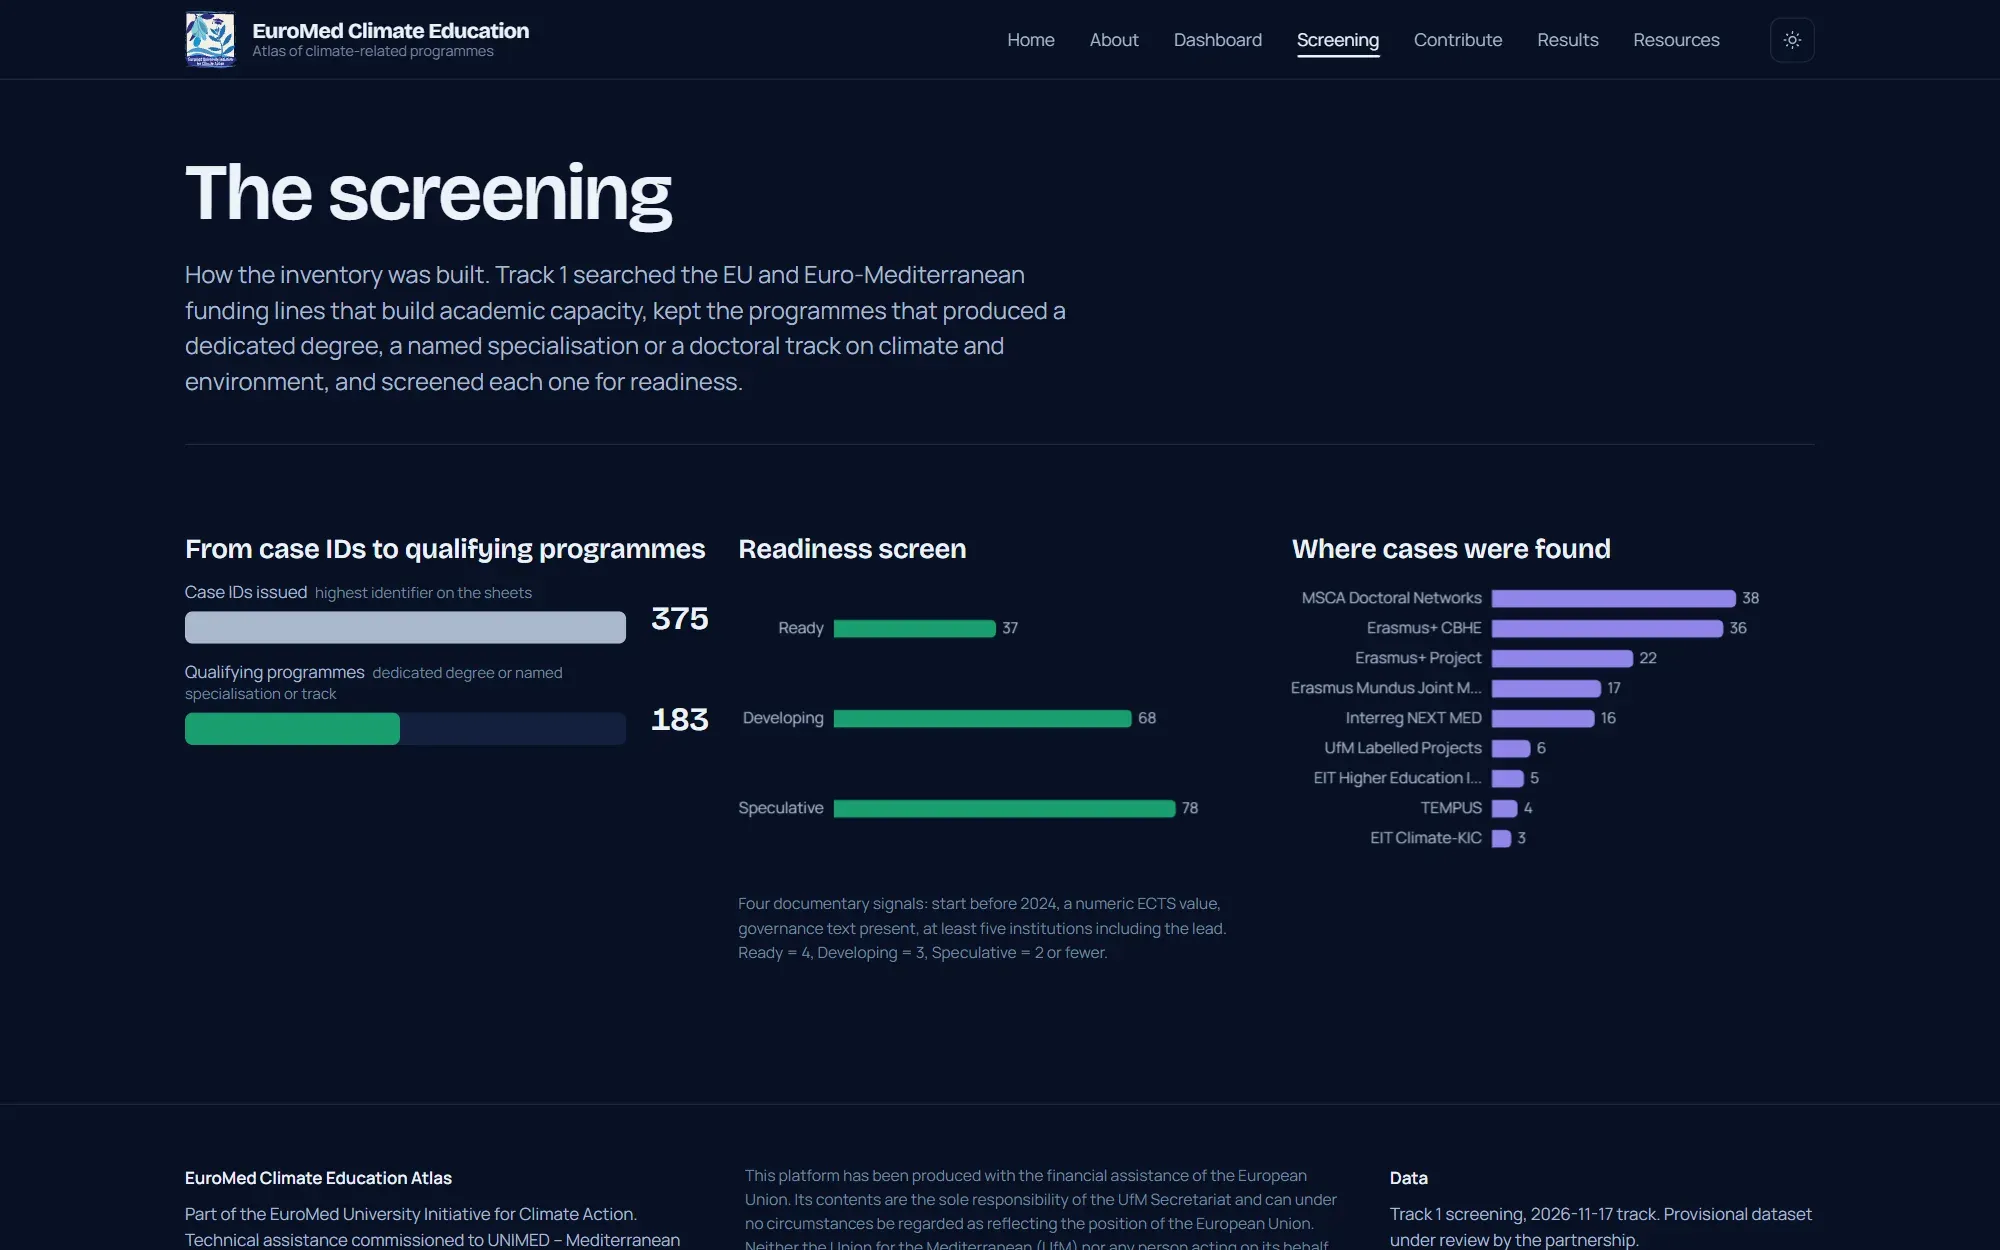
Each programme has a record with its key data and the consortium map. The screening page explains how the inventory was built. The visual design starts from the colours of the initiative’s logo, with a light and a dark theme, and is designed for desktop and smartphone.
The platform is online at euromed-climateedu.eu.
3 items
Get in touch